The average cost per click in Google Ads reached $5.42 in 2026, more than double the $2.32 average recorded a decade ago, according to WordStream’s latest Google Ads benchmarks. For eCommerce brands, however, CPC alone does not determine whether Google Ads are expensive. Product margins, average order value, conversion rate, competition, and target ROAS all affect how much a brand can afford to pay for each click.
This makes the question “How much do Google Ads cost?” difficult to answer. Two stores can pay the same CPC and see very different results due to differences in product economics, conversion rates, feed quality, and campaign structure.
In this article, we’ll break down Google Ads costs in 2026, review the latest CPC benchmarks, explain what affects ad costs, and show how eCommerce brands can set a realistic budget and improve ROAS across Search, Shopping, and Performance Max campaigns.
How Does Google Ads Work?
For most ad formats, Google primarily uses the pay-per-click (PPC) model, meaning advertisers are charged only when a user clicks on their ad, not when it’s displayed.
Alternatives include cost-per-mille (CPM) for display campaigns and cost-per-view (CPV) for video ads, typically on YouTube. However, with Google’s increasingly machine-learning-driven ad formats – such as Performance Max – advertisers can optimize bids toward conversions, engagement, or other goal-oriented outcomes, even though charges are still triggered by clicks or impressions.
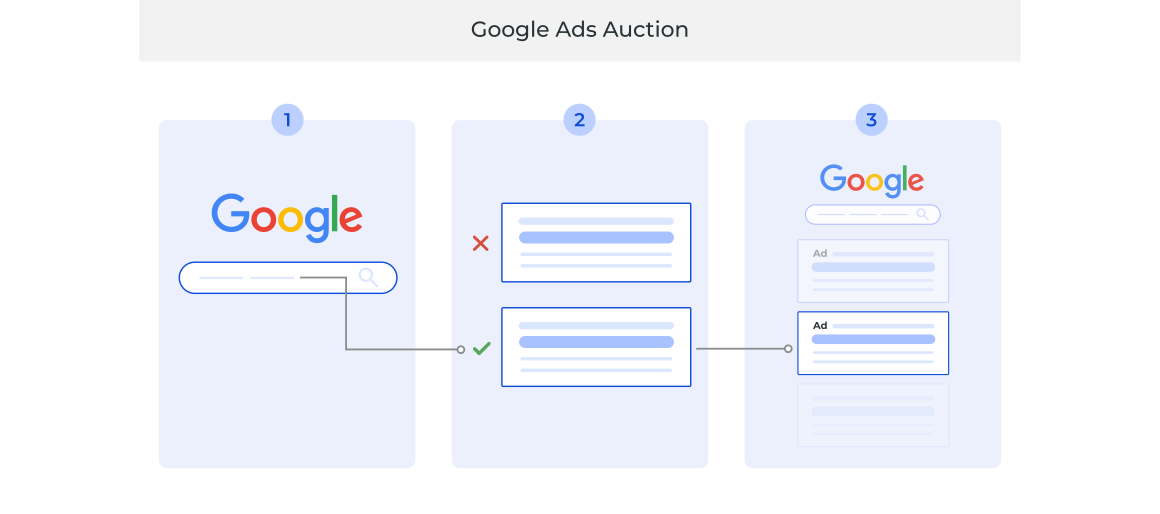
How Does Google Ads Pricing Work?
The Google Ads auction determines which ads appear to users and takes place every time someone performs a search on Google or visits a website with ad placements. Depending on the campaign type and bidding strategy, advertisers are charged for clicks, impressions, or views.
Rather than relying on a single fixed formula, Google Ads uses a real-time auction that evaluates multiple signals to determine ad rank and pricing. These include:
- Bids (manual or automated). Advertisers define their bidding strategy – such as manual CPC or automated Smart Bidding (e.g., target CPA or target ROAS). With automated bidding, Google dynamically adjusts bids in real time based on the likelihood of achieving the desired outcome.
- Auction-time quality signals. Google evaluates the relevance and expected performance of each ad at the moment of the auction, using signals such as predicted click-through rate, ad relevance, and landing page experience. While Quality Score remains a useful diagnostic metric within the account, it is not used directly as a fixed multiplier in the auction.
- Contextual signals. User-specific factors such as device, location, search intent, time of day, and other contextual signals influence how ads compete in each individual auction.
- Expected impact of ad assets and formats. Additional assets, including sitelinks, callouts, images, or other formats, can improve ad visibility and engagement. Google considers the expected impact of these assets when determining ad rank.
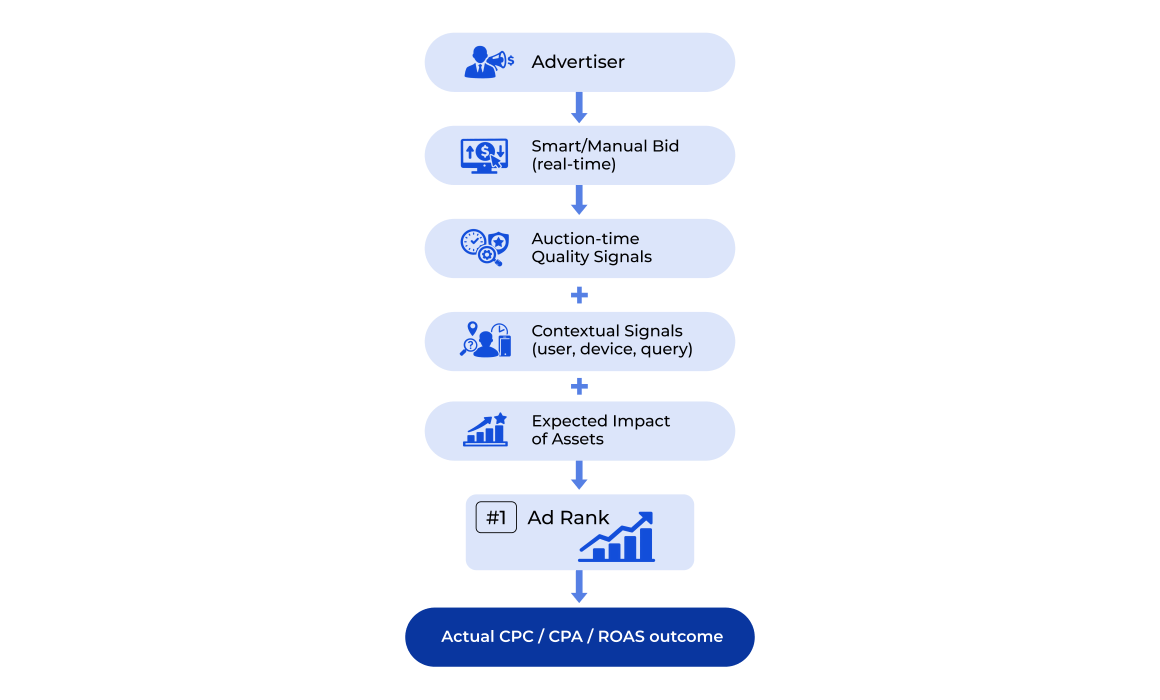
Based on these real-time signals, Google determines ad rank and calculates the actual cost per click or impression, while automated bidding strategies optimize toward CPA or ROAS goals.
Average Google Ads CPC in 2026
According to WordStream by LocaliQ, the average CPC for search advertising across all industries is $5.42 in 2026. The same report puts the average CTR at 6.64%, the average conversion rate at 8.18%, and the average cost per lead at $66.69.
These figures provide a useful market benchmark, but CPC varies significantly by industry. The table below shows the average Search Ads CPC across 23 business categories.
| Industry | Average CPC |
| Animals & Pets | $4.06 |
| Apparel / Fashion & Jewelry | $4.44 |
| Arts & Entertainment | $1.63 |
| Attorneys & Legal Services | $9.87 |
| Automotive: For Sale | $2.27 |
| Automotive: Repair, Service & Parts | $4.35 |
| Beauty & Personal Care | $4.62 |
| Business Services | $5.87 |
| Career & Employment | $5.81 |
| Dentists & Dental Services | $8.00 |
| Education & Instruction | $4.81 |
| Finance & Insurance | $3.39 |
| Furniture | $3.97 |
| Health & Fitness | $6.17 |
| Home & Home Improvement | $8.33 |
| Industrial & Commercial | $5.87 |
| Personal Services | $7.17 |
| Physicians & Surgeons | $4.76 |
| Real Estate | $3.22 |
| Restaurants & Food | $2.05 |
| Shopping, Collectibles & Gifts | $4.14 |
| Sports & Recreation | $2.77 |
| Travel | $2.14 |
Source: WordStream by LocaliQ, 2026 Search Advertising Benchmarks
Note: A simple average of CPCs across industries may differ from the overall market average because industries generate different volumes of clicks.
The differences between industries can be substantial. Attorneys & Legal Services has an average CPC of $9.87, while Arts & Entertainment averages only $1.63. However, these figures refer to Search Ads within each business category. For example, the $4.14 CPC for Shopping, Collectibles & Gifts does not represent the average cost of the Google Shopping ad format.
Google Ads for eCommerce in 2026: Costs, Budgets & Seasonal Strategy
General CPC benchmarks provide useful market context, but eCommerce brands need to account for campaign format, unit economics, growth targets, and seasonal demand. The sections below translate those benchmarks into practical Google Ads costs and budget decisions.
Search vs. Shopping vs. Performance Max: What eCommerce Brands Actually Pay
For eCommerce brands, campaign format provides a more relevant benchmark than the general cross-industry Search average. Data from more than 500 Shopify and DTC accounts shows that Search, Shopping, and Performance Max have different CPC, CVR, CPA, and ROAS benchmarks.
| Campaign type | Average CPC | Average CVR | Average CPA | Average ROAS |
| Search | $1.42 | 2.8% | $50.71 | 3.4x |
| Shopping | $0.68 | 1.4% | $48.57 | 5.1x |
| Performance Max | $0.82 | 1.9% | $43.16 | 4.8x |
Source: COREPPC, Google Ads Benchmarks for Ecommerce: 2026 Data
Shopping has the lowest average CPC at $0.68, compared with $1.42 for Search and $0.82 for Performance Max. It also has the highest average ROAS at 5.1x in this dataset. Performance Max has the lowest average CPA at $43.16.
CPC also varies across eCommerce verticals:
| eCommerce vertical | Search CPC | Shopping CPC |
| Fashion & Apparel | $0.95 | $0.42 |
| Health & Beauty | $1.65 | $0.78 |
| Home & Garden | $1.28 | $0.61 |
| Jewelry & Accessories | $1.72 | $0.82 |
These benchmarks show why eCommerce brands should not use the overall $5.42 Search CPC as a direct estimate for their Google Ads budget. Campaign format, product category, margins, average order value, conversion rate, and target ROAS all affect how much a brand can afford to pay for each click.
A lower CPC also does not guarantee better profitability. An eCommerce brand should evaluate CPC alongside CPA, CVR, AOV, margins, and ROAS to determine whether its Google Ads spend supports profitable growth.
How Much Do Small Businesses Spend on Google Ads in 2026?
The CPA benchmarks above provide a practical basis for budget estimates. Across Search, Shopping, and Performance Max, the average CPA is about $47.50. At this level, a monthly Google Ads budget of $2,000 to $8,000 could support roughly 40 to 170 new customers, provided that campaign performance remains close to these benchmarks.
According to Ryze AI’s 2026 eCommerce Google Ads guide, 67% of eCommerce businesses spend between $2,000 and $8,000 per month on Google Ads. The right budget for each brand depends on product margins, average order value, target ROAS, inventory capacity, and demand. Brands with stable performance may invest more during seasonal peaks, promotions, product launches, or expansion into new markets.
How to Calculate Your eCommerce Google Ads Budget Step-by-Step
Industry averages can help set expectations, but your own unit economics should determine your budget. Two simple formulas provide a useful starting point.
Method 1: Start with your acquisition target
Use this formula:
Monthly Google Ads budget = Target new customers × Acceptable CPA
If your goal is 100 new customers per month and your acceptable CPA is $45, the calculation is:
100 × $45 = $4,500 per month
Your acceptable CPA should reflect your average order value, contribution margin, repeat purchase rate, and profitability target.
Method 2: Start with your revenue target
Use this formula:
Monthly Google Ads budget = Target revenue ÷ Target ROAS
If your monthly Google Ads revenue target is $40,000 and your target ROAS is 5x, the calculation is:
$40,000 ÷ 5 = $8,000 per month
You can then cross-check the result against your AOV:
Required orders = Target revenue ÷ Average order value
For a $40,000 revenue target and a $100 AOV:
$40,000 ÷ $100 = 400 orders
An $8,000 budget across 400 orders implies a maximum CPA of:
$8,000 ÷ 400 = $20
Here is how the same framework can apply to different eCommerce profiles:
| Store profile | AOV | Target revenue | Target ROAS | Required orders | Estimated budget | Implied CPA |
| Emerging brand | $60 | $20,000 | 4x | 333 | $5,000 | ~$15 |
| Fashion brand | $100 | $40,000 | 5x | 400 | $8,000 | $20 |
| Premium brand | $180 | $90,000 | 6x | 500 | $15,000 | $30 |
| High-AOV brand | $300 | $150,000 | 5x | 500 | $30,000 | $60 |
These figures are examples, not universal benchmarks. Before you use the result as a final budget, check whether the implied CPA leaves enough margin after product costs, discounts, shipping, payment fees, and other variable expenses.
Quick Google Ads Budget Worksheet
| Metric | Your number |
| Target monthly Google Ads revenue | $_____ |
| Average order value | $_____ |
| Required orders | _____ |
| Target ROAS | _____x |
| Maximum acceptable CPA | $_____ |
| Estimated monthly ad budget | $_____ |
If your revenue-based budget and CPA-based budget produce very different results, revisit your assumptions before you increase spend. The goal is not to match an industry average. It is to find a budget that can support your revenue target without pushing acquisition costs beyond a profitable level.
Google Ads Costs During BFCM & Peak Season for eCommerce
Peak periods such as Black Friday, Cyber Monday, holiday sales, and major promotional events can change Google Ads economics quickly. More brands compete for the same high-intent shoppers, which can put pressure on CPC, CPA, and required daily budgets.
For eCommerce brands, the solution is not to apply the same percentage increase to every campaign. Seasonal budgets should reflect inventory, promotional margins, historical conversion rates, target ROAS, and expected demand.
A practical seasonal budget plan should answer four questions:
- How much inventory can you sell profitably? Higher ad spend has little value if stock constraints prevent the brand from capturing additional demand.
- How much does the promotion reduce your margin? A larger discount can increase conversion rate but also reduce the CPA that the business can afford.
- Which campaigns deserve additional budget? Search, Shopping, and Performance Max should receive more spend only when their marginal CPA or ROAS remains within target.
- How early should the budget increase start? Brands should allow campaigns enough time to collect data before the main sales period instead of making a large budget change only when the peak begins.
For example, a brand that normally targets 5x ROAS may need to recalculate its acceptable CPA before a 20% promotion because the lower margin changes the economics of each order. A higher conversion rate during BFCM can offset some of that pressure, but the brand should base the decision on actual profitability rather than traffic volume alone.
The most effective seasonal strategy treats the regular monthly budget as a baseline. Additional peak-season spend should depend on available inventory, promotional economics, and the ability of each campaign to generate profitable incremental revenue.
How Much Does It Cost to Run a Google Ad in 2026?
Like the question, “How much do Google keywords cost?” the answer is still: “It depends.” There’s no single number or percentage that fits every brand or account. Google Ads pricing varies widely depending on factors such as campaign goals, industry, location, account structure, performance signals, and competition.
While market-wide CPCs have generally increased in 2025-2026 due to higher competition across many sectors, advertisers are not without control. At the individual account level, CPCs can still be stabilized or even reduced through better targeting, improved relevance, and the effective use of automation.
Tools like Smart Bidding, combined with thoughtful campaign structure and ongoing optimization, help advertisers allocate budget more efficiently and optimize spend toward conversions over time – even in increasingly competitive environments.
When considering Google PPC costs and mapping out your budget, several key factors should be taken into account.
1. Expected revenue from a new customer
For businesses where a single customer generates a profit of $1,000-$10,000, investing $100-$500 per day in Google Ads can be worthwhile. In highly competitive industries such as legal, finance, or healthcare, daily spend may exceed $500-$1,000 to achieve meaningful visibility. For brands with lower-priced products or services, daily and monthly budgets should align with the revenue potential of new customers.
2. The scope of your campaigns
If you plan to promote multiple products across several campaigns, you’ll need to allocate your budget by segment based on expected ROAS. Google’s Performance Planner is a helpful tool to estimate spend and forecast performance.
3. Keywords and campaign structure
Using broad keywords with low purchase intent often results in wasted spend, which is why keyword match types and campaign structure play a critical role, including how you split budget between branded and non-branded keyword bidding. High-intent, long-tail keywords are more likely to convert and help control CPC, with Keyword Planner supporting effective keyword selection.
Beyond keyword selection, eCommerce businesses should not limit their campaigns to Search alone. Shopping and Performance Max are key formats for showcasing product inventory and driving conversions alongside search-based targeting.
4. Conversion rates
Profitability depends heavily on your CVR. Your campaign’s setup, chosen keywords, and targeted audience all influence results, but landing page experience is equally important. Check your site’s organic traffic CVR – are there drop-offs? Are best practices followed? Any optimization opportunities?
For a structured way to answer these questions, see our step-by-step Google Ads audit guide for eCommerce brands.
5. Budget planning and control
For new campaigns, a $50 to $150 daily budget can provide enough room to collect initial performance data and test campaign structure without excessive spend. This starting range is different from the $2,000 to $8,000 monthly budget discussed above, which is a broader benchmark for small eCommerce businesses with active campaigns and more established performance data.
There is no strict minimum budget, but very low spend, such as $10 per day, can limit ad delivery and slow down data collection. Google Ads also gives advertisers several ways to control spend through campaign budgets, bid strategies, audience and location settings, device adjustments, and ad schedules.
Additional Costs Involved in Google Ads
Your ad budget is obviously the largest expense in a Google Ads campaign, but it’s not the only cost. Other factors can influence your spend depending on your strategy, goals, business, and individual situation. Here are the main ones:
Hiring an agency
For busy entrepreneurs, entrusting your PPC work to a digital marketing agency can be cost-effective. They bring expertise, time-saving benefits, and the potential to prevent costly blunders. However, be prepared for agency fees, typically around 10% of your ad spend. Some agencies may also offer performance-based pricing, where part of the fee depends on campaign results. If you’re comparing options, our breakdown of the best Google Ads agencies for eCommerce brands covers what to look for. Remember, not all agencies guarantee a specific return on investment, so do your research and choose wisely.
Tracking and optimization tools
Using tools like Google Analytics 4, Google Tag Manager, and Data Studio helps you understand which keywords drive conversions, how visitors interact with landing pages, and where potential bottlenecks exist. While applying these insights requires effort, they can significantly improve CVR and ROI. Today, AI-driven insights and Smart Bidding recommendations further enhance campaign efficiency and help reduce wasted spend.
Ad copy and visuals
High-quality, targeted writing and captivating visuals boost click-through rates and conversions. Freelance designers or copywriters can help unlock this creative potential. Additionally, generative AI is widely used today for creating ad copy, visuals, and videos. While AI speeds up production, advanced tools, prompt engineering, and creative oversight may introduce additional costs.
A/B testing
Running experiments on different elements – headlines, images, calls to action – allows you to identify the most effective variants. While A/B testing involves extra effort and cost, Google Ads now provides automated experiment setups that reduce manual work while still testing multiple variations.
Expanding the network
The Google Display Network gives access to websites and apps, broadening your reach. Careful targeting is essential to avoid irrelevant impressions and control costs. Today, expanding your reach can include YouTube, Discovery, and Gmail placements, in addition to traditional Display campaigns. For example, a boutique travel agency may focus on travel blogs and luxury lifestyle sites, while an eco-friendly cleaning product performs best on green living blogs rather than car enthusiast forums.
Other Factors that Influence Your Google Ads Costs
The cost of advertising can have a major impact on the success of your campaign. Several additional factors also influence how much you pay for Google Ads, including bidding strategy, dayparting, geotargeting, and device targeting. Let’s break down these components and see how they affect your costs.
- Bidding strategy. The bidding strategy you choose has a direct impact on CPC and total spend. For example, using a target ROAS strategy may result in higher CPCs compared to a target CPA, as the system optimizes for higher-value conversions rather than cost-per-acquisition alone. Choosing the right bidding strategy depends on your campaign goals, profit margins, and how much you are willing to pay for conversions.
- Dayparting. Dayparting lets you target specific times of day or days of the week when users are more likely to click your ad. For example, if most of your customers shop during weekday evenings, running campaigns at those times could increase clicks and lower your CPC. Using dayparting helps you focus your budget when your audience is most active. Today, Smart Bidding can automatically adjust bids by time of day based on performance data, but manual scheduling can still be useful for testing or additional budget control.


- Geotargeting. Geotargeting allows you to focus on specific geographic locations where users are more likely to engage with your ads. Beyond physical location, Google also considers location intent, meaning users searching for services in a particular area may see your ads even if they aren’t physically there. By targeting local or regional markets instead of broad, global areas, you can reduce CPCs and reach a more relevant audience.
- Device targeting. Device targeting helps control costs by showing ads on certain devices, such as smartphones, tablets, or desktops. This ensures your ads appear correctly and reach users most likely to convert. While manual device bid adjustments are still available, automated bidding strategies increasingly optimize performance across devices without manual effort. For instance, if most of your customers use iPhones or iPads, targeting those devices with optimized creatives can improve results.
All four strategies – bidding strategy, dayparting, geotargeting, and device targeting – help reduce Google Ads costs while ensuring your campaigns reach the most relevant audience and generate better ROI.
Google Ads vs. Other Platforms: Is It Worth the Investment?
Google Ads is not the only option for eCommerce brands. Meta, TikTok, Pinterest, and other platforms can support different stages of the customer journey, but their click costs and user intent vary significantly.
| Platform / campaign type | 2026 CPC benchmark | Best suited for |
| Google Search, eCommerce | $1.42 | High-intent product searches |
| Google Shopping | $0.68 | Product discovery and direct sales |
| Performance Max | $0.82 | Cross-channel eCommerce conversions |
| Meta Ads, prospecting | $0.80–$1.50 | Demand generation and new customer acquisition |
| TikTok Ads | $0.50–$1.20 | Product discovery and visual-first brands |
Sources: COREPPC, Google Ads Benchmarks for Ecommerce: 2026 Data; COREPPC, Ecommerce Advertising Benchmarks: CPC, CPA, ROAS by Channel (2026)
Lower CPC does not necessarily mean better performance. TikTok and Meta can generate cheaper clicks and reach shoppers before they actively search for a product, while Google Search and Shopping capture stronger purchase intent.
For most eCommerce brands, the better comparison is CPA, ROAS, and incremental revenue rather than CPC alone. Google Ads can capture existing demand, while Meta and TikTok can create and expand demand. A cross-channel strategy can use each platform for the role it performs best.
How to Optimize Your Google Ads Campaign
Optimizing your Google Ads involves both careful budget management and increased effectiveness. To improve your campaign performance, you can look for professional Google Ads services or take the following steps:
- Refine keywords and listings. Focus on relevant long-tail keywords and optimize your Google Merchant listings. Accurate titles, descriptions, and images improve visibility in Shopping and Performance Max, enhance relevance, and help convert targeted traffic.
- Develop clear ad copy. Create clear and compelling ad copy that highlights your unique selling propositions (USPs) and addresses your audience’s needs. Use numbers, calls to action, and relevant terms to give Google’s algorithms more signals for optimizing ad delivery. Many advertisers now use AI to write and test ad copy at scale.
- Optimize landing pages. Ensure your landing pages fully align with your ads and keywords. Provide users with clear information, minimize distractions, and create a straightforward path to conversion.
- Use Smart Bidding strategies. Apply automated bidding strategies, such as target CPA or target ROAS, allowing Google to dynamically adjust bids based on the likelihood of conversions and your campaign goals.
- Test and monitor results. Regularly test different ad variations, keywords, and landing pages, track performance, and make data-driven adjustments. This helps improve ROI, adapt to changing conditions, and increase conversions over time.

Future Trends
Digital advertising is constantly evolving, and businesses need to stay up to date on trends shaping Google Ads pricing and performance. Here are some key developments:
- Machine learning: ML is increasingly shaping how campaigns are optimized. Google’s Smart Bidding adjusts real-time bids based on signals like device, location, time of day, and predicted conversion likelihood to maximize results.
- Mobile advertising: Most Google Ads traffic and conversions now come from mobile devices. Businesses must ensure ads and landing pages are mobile-friendly, use appropriate formats such as video or app promotion, and account for mobile user behavior.
- CPC and CPM increases: Rising competition, automation, and higher advertiser demand continue to push costs upward. Efficiency and optimization are more important than ever.
- Pricing and policy changes: With the deprecation of third-party cookies, first-party data strategies are increasingly important. Businesses must adapt to maintain performance and accurate measurement.
To combat rising costs, follow these best practices:
- Build campaigns that maximize relevancy between keywords, ads, and landing pages.
- Invest time in effective ad copy and regularly refresh assets to improve CTR.
- Add all applicable ad assets to increase visibility and engagement.
- Ensure landing pages are well-optimized for desktop and mobile.
- Use negative keywords and placements to reduce irrelevant spend.
- Apply bid adjustments to prioritize high-performing audiences, locations, and devices.
Frequently Asked Questions
Yes, if campaigns meet your profitability targets. For eCommerce brands, metrics such as CPA, ROAS, average order value, product margins, and customer lifetime value matter more than CPC alone.
According to WordStream, the average Search Ads CPC across industries is $5.42 in 2026. For eCommerce, average CPCs are lower, at $1.42 for Search, $0.68 for Shopping, and $0.82 for Performance Max in the COREPPC dataset.
According to Ryze AI’s 2026 eCommerce Google Ads guide, 67% of eCommerce businesses spend between $2,000 and $8,000 per month. The right budget depends on CPA, ROAS, margins, inventory, and demand.
The average Search Ads cost per lead is $66.69 in 2026, according to WordStream. For eCommerce brands, CPA is often more relevant, with benchmarks of $50.71 for Search, $48.57 for Shopping, and $43.16 for Performance Max.
Use the formula Monthly Google Ads budget = Target new customers × Acceptable CPA. For example, 100 new customers at a $45 CPA would require an estimated monthly budget of $4,500.
Google Ads uses an auction system, so competition, keywords, audience, location, bid strategy, ad relevance, and campaign structure all affect CPC. For eCommerce brands, product feed quality and campaign format also influence costs.
Not always. Google Ads often captures existing purchase intent, while Meta Ads can help reach new audiences and create demand, so eCommerce brands should compare CPA, ROAS, and revenue rather than CPC alone.
In the 2026 eCommerce benchmarks above, Shopping has the lowest average CPC at $0.68, while Performance Max has the lowest average CPA at $43.16. The best option still depends on product category, margins, feed quality, and campaign goals.
Google Ads can generate traffic and conversions soon after launch, but reliable CPA and ROAS data requires enough conversions. The timeline depends on budget, traffic volume, demand, campaign structure, and conversion rate.
Seize Control of Your Google Ads Costs
Google pay-per-click costs are generally rising, especially as industries become more competitive. But with smart campaign strategies, automation, and AI-driven tools, you can stabilize or even lower your CPC while maximizing ROI.
Don’t rely on guesswork – optimize keywords, product listings, ad copy, and landing pages, use Smart Bidding to automate bid adjustments, regularly refresh creative assets, and track campaign performance. For eCommerce, this also means fully optimizing Shopping and Performance Max campaigns. By aligning these strategies, your campaigns perform more effectively, enhancing ad relevance, boosting conversions, and driving measurable growth.
.


So why agree on rising costs when you can partner with us to make every cent count? Our digital strategy consultancy knows how to bring your CPC down, saving you money while driving revenue. The growth you’ve been seeking is just a consultation away.