We wanted to see how far Claude Artifacts could be pushed beyond simple documents and prototypes. In particular, we wanted to test whether they could support something closer to a real analytics product: a dashboard connected to live data, with Claude generating insights directly inside the report.
For this experiment, we used what Anthropic then called Live Artifacts in Claude Cowork and built an internal marketing analytics app. Anthropic has since moved Cowork to its updated Artifacts system, but the core capabilities that made the experiment interesting are still relevant today.
In this article, we share what we built, what became difficult as the artifact grew, and which development and testing practices made the project manageable.
Live Artifacts And What Changed
Live Artifacts were persistent, interactive pages built inside Claude Cowork. Unlike a static output from a chat, they could act more like small applications, connecting to external tools, using Claude at runtime and maintaining state between sessions.
On August 19, 2026, Anthropic moved Cowork to its updated Artifacts system. Existing Live Artifacts continue to work, but they can no longer be edited in place. New Cowork artifacts are saved to the user’s account, keep version history, can be opened on Claude Desktop and the web, and can use connected apps and ask Claude questions.
The capabilities that mattered most for our use case were:
- Live connection to data. Artifacts can use connected apps and MCP tools to retrieve current data instead of relying only on information captured when the artifact was created. In the legacy Live Artifact we built, this was implemented through window.cowork.callMcpTool.
- Embedded AI. Artifacts can include Claude-powered functionality, allowing an application to interpret data, generate content or respond to user input. In the legacy Live Artifact we built, this capability was exposed through window.cowork.askClaude.
- Persistent state. Published artifacts can store data across sessions. Storage can be personal, where each user keeps their own private state, or shared, where several users interact with the same stored data.
In short, Claude Artifacts can combine an interactive interface with connected data, AI functionality and persistent state. For our experiment, that made them interesting as a potential interface for analytics rather than simply another format for presenting static information.
One important constraint for internal reporting is that access to connected data remains user-specific. Each person who opens an artifact uses their own connected apps and permissions. Sharing an artifact does not automatically share the creator’s access to the underlying data.
What We Built
When we first started experimenting with Live Artifacts from a BI perspective, we had two immediate questions. Could they replace traditional BI dashboards? And could we build one with embedded AI that generates insights and analysis directly inside the report?
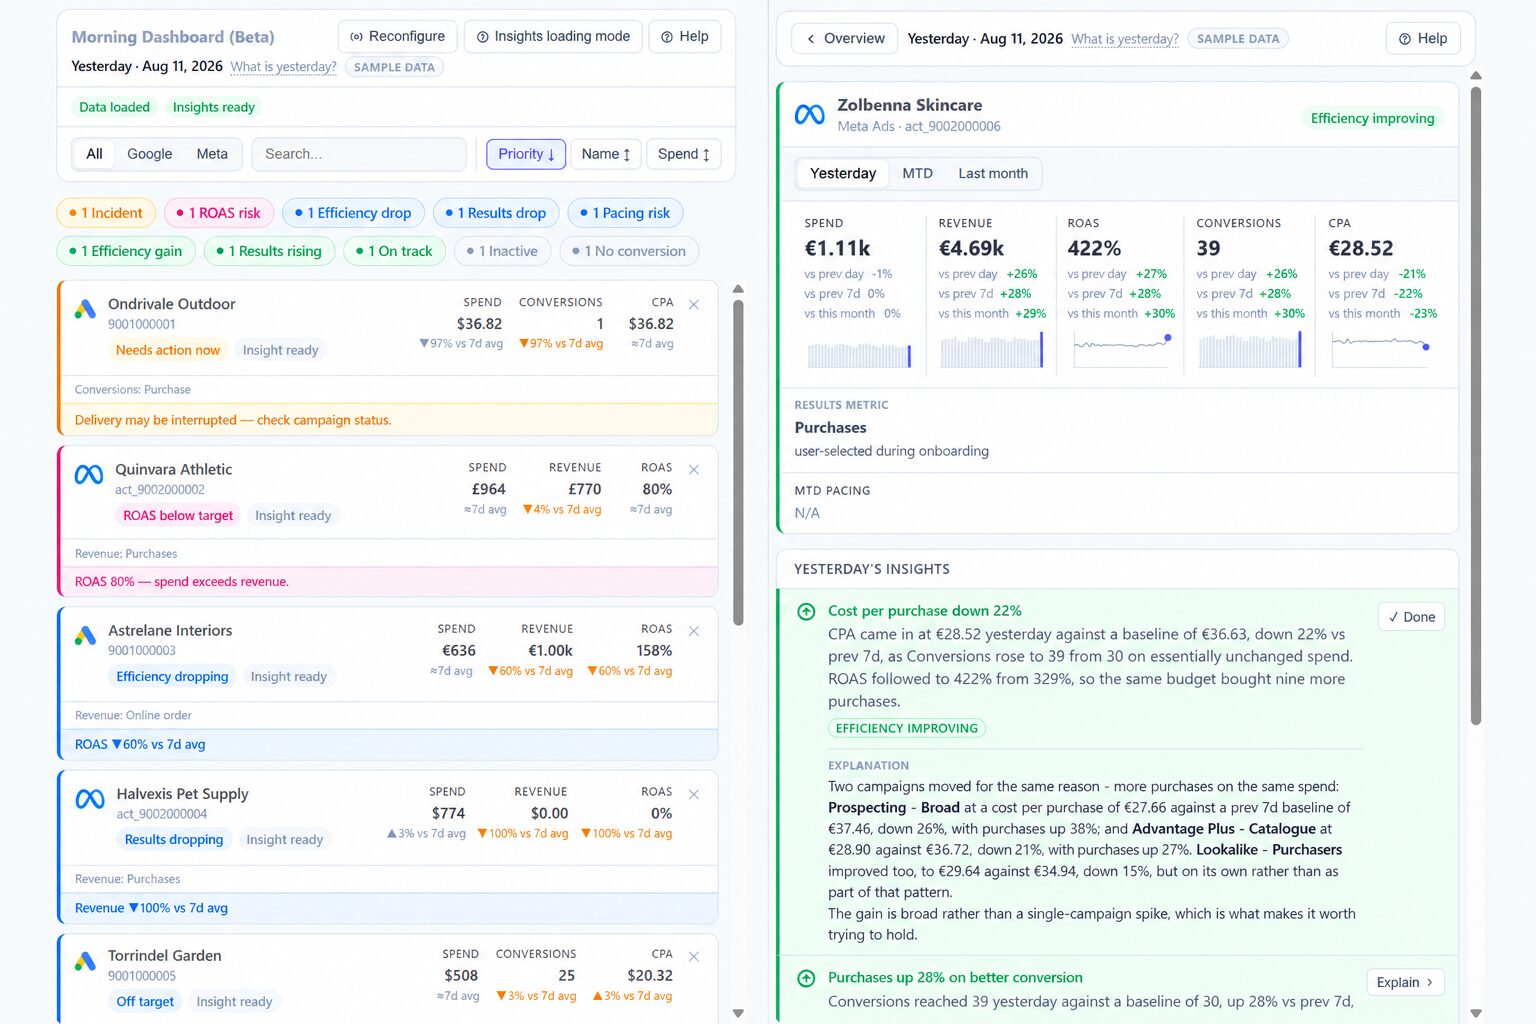
To test this, we built an internal app for account managers. It presents all the accounts a manager is responsible for as a feed of cards. Opening a card shows the performance of that account together with AI-generated insights and analysis. Users can also customise the feed by selecting only the accounts relevant to them.
You can see a public demo of the interface here.
How The Artifact Worked
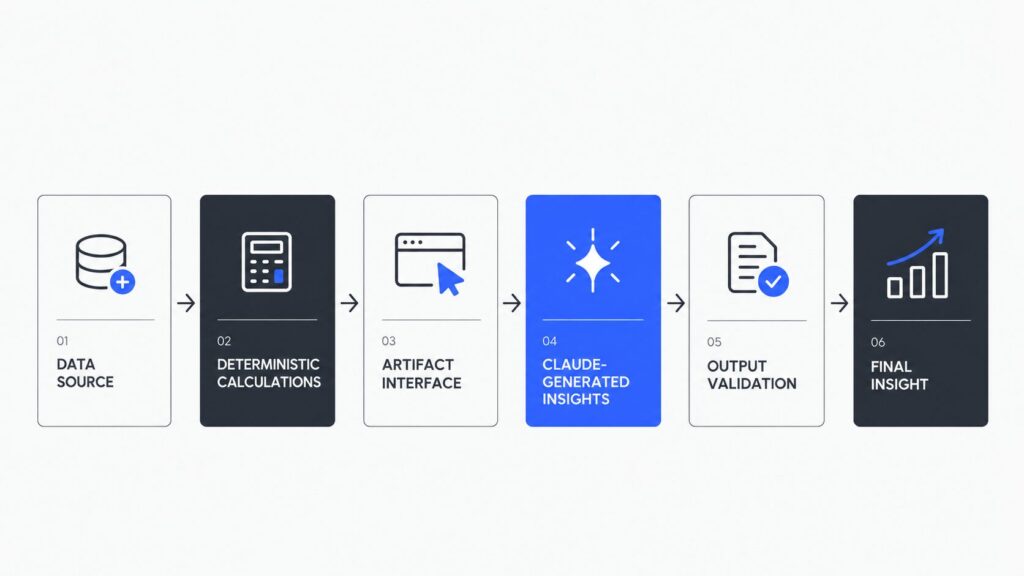
At a high level, the artifact had three main layers. It retrieved current data from the connected source, calculated the metrics required for the report and then passed those calculated values to Claude to generate written insights.
The important distinction was that the code remained responsible for the numbers. Claude was responsible for interpreting those numbers and turning them into readable analysis. Before an AI-generated insight was shown to the user, the figures in the generated text were checked against the values calculated by the code.
The simplified flow looked like this:
What We Learned While Building It
The capabilities of Cowork Live Artifacts sounded promising, but building something complex with them came with its own challenges.
1. Define The Vision And Architecture Upfront
If it is going to be something big, it helps to think about the artifact as a product and treat its development like product development. We found it useful to define a product spec, a technical spec and an architecture vision upfront, so Claude had a clear picture of what we wanted to build. We also used Claude to brainstorm and refine these ideas. In our experience, it was more useful for challenging product decisions than for making those decisions for us.
2. Set Up Git And GitHub Before Touching Code
Non-negotiable when working with code. There are a thousand reasons why something might go wrong during a vibe coding session, so no need to explain further.
3. Our Live Artifact Shipped As A Monolith
The Live Artifact we built was ultimately shipped as a single HTML page. As the project grew, making changes or adding new features without breaking unrelated functionality became increasingly difficult. To make this manageable, we made two changes to our development process:
- Split the code into JS modules, so that making a change means editing one or several files, not the entire artifact.
- Create a build procedure consisting of several steps: building the single file, then code verification and tests, and only then publishing the new version of the artifact.
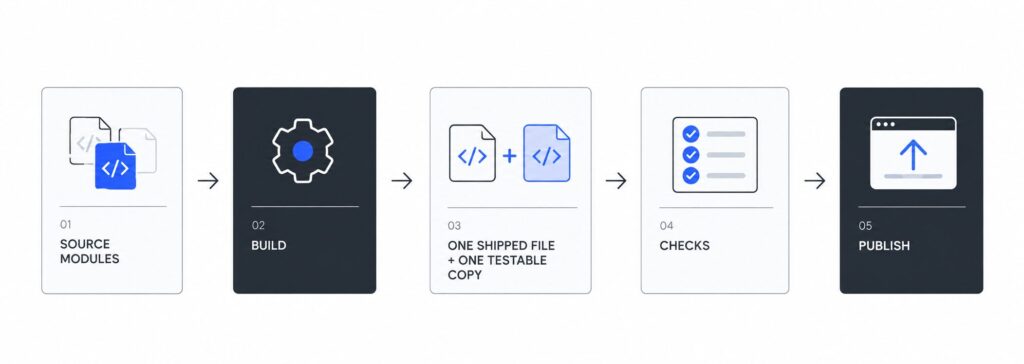
Without these two changes to the work process, any one change causes several more bugs.
4. Use AI-Driven Code Development Practices
Another important working process change was the shift away from simply telling the LLM to change something and then fixing the bugs those changes caused, towards AI-driven code development practices.
Incorporating established software development practices into AI coding sessions made a significant difference to our process. It gave the development process more structure and significantly improved the quality of the output.
We used a set of skills published by Matt Pocock that together form a development cycle. First, we use /grill-with-docs to have Claude interview us about the requirements. It asks questions until the requirements are clear, identifies contradictions and can point out when a question has already been settled. The results of that interview are turned into specs with /to-spec, which are then broken down into tickets with /to-tickets. Tickets are implemented with /implement, and /code-review runs afterwards.
The interview stage also produced architecture decision records (ADRs), which are short notes capturing one decision, the reasoning behind it and what it rules out. The reason to write them is practical: a decision that exists only in a chat transcript will be re-argued next session, or quietly reversed by a change that never knew it was a decision.
We found this approach particularly helpful for keeping development structured as the artifact became more complex.
5. Testing Was Never As Important As It Is Now
We ended up with four layers of testing. Distinguishing between them was important because each one catches a different type of problem.
- Contract. A build-time check that the file parses, includes every module it should, stays self-contained and touches nothing it should not. This is the layer that catches a missing function or syntax error.
- Logic. A build-time check that, for a given set of numbers, the code reaches the right conclusion about them and states it in a way that is not misleading. For example, it checks that a drop really is a drop and that it is not described as dramatic when it is within normal variation.
- AI output. Our artifact generates its insights with Claude inside the page, so we needed a check that every figure in a sentence the model has just written matches the figure the code calculated. If the check fails, the artifact falls back to a plain templated sentence. The principle was simple: Claude could write the wording, but the code remained the source of truth for the numbers.
- Manual check. Opening the page to see whether it actually runs and whether the data arrives. We do this every time, and nothing automates it.
Can Claude Artifacts Replace BI Dashboards?
Based on our experiment, we would not treat Artifacts as a replacement for traditional BI platforms. Instead, we see them as a complementary layer on top of existing analytics infrastructure.
Traditional BI is still better suited for:
- governed metrics and reusable data models;
- standardised reporting across larger organisations;
- permissions, consistency and reliability at scale.
Artifacts become interesting when the goal is to:
- build a highly customised interface around existing data;
- combine live data with AI-generated interpretation;
- create tools for a specific team, workflow or use case.
For us, the more useful question is not whether Artifacts can replace BI dashboards, but where they can make the analytics experience more useful.
Final Takeaways
Our experiment showed that Claude Artifacts can go considerably further than simple documents and prototypes, especially when they use live data and embedded AI. At the same time, the closer an artifact gets to a real internal product, the more important traditional development practices become.
For us, the most interesting role for Artifacts is not to replace BI entirely. It is to create more tailored interfaces around existing analytics data and add an AI layer that helps users interpret the results.