
An eCommerce brand can report strong campaign performance and still struggle to grow profitably.
The problem is not always poor marketing. Often, it is the metric used to judge success. A number that looks impressive in a dashboard may hide rising acquisition costs, weak margins, or inefficient spending.
In this article, we’ll compare MER vs ROAS vs CAC to determine which metrics reveal the true state of your marketing performance and which may lead to costly decisions.
Why One Marketing Metric Is Never Enough
Marketing performance rarely fits into a single number. A campaign can generate strong platform-reported returns while customer acquisition becomes more expensive. At the same time, overall revenue may rise even as margins shrink and marketing efficiency declines.
This happens because every metric captures only one part of the customer journey and business performance. When brands rely too heavily on a single KPI, they risk scaling campaigns that look successful in a dashboard but fail to create sustainable growth.
To understand what is really happening, eCommerce teams need to evaluate marketing efficiency from several perspectives rather than searching for one universal metric.
Knowing your ROAS, MER, and CAC is only the first step. Sustainable growth depends on turning these metrics into a unified decision-making framework that aligns marketing investments with business outcomes. Learn how our eCommerce growth marketing services help brands build measurement systems that support smarter, more profitable growth.
MER vs ROAS vs CAC: Side-by-Side Comparison
Before looking at each metric in detail, here is a quick comparison of what MER, ROAS, and CAC measure, where they are most useful, and what they can miss.
| Metric | Formula | Scope | Best Used for | Main Limitation |
| ROAS | Revenue attributed to ads ÷ ad spend | Individual campaign or channel | Creative testing, campaign optimization, and channel-level decisions | Depends on platform attribution and does not reflect total business profitability |
| MER | Total revenue ÷ total marketing spend | Entire marketing operation | Evaluating overall marketing efficiency, budgeting, and executive reporting | Does not show which specific channel is driving the result |
| CAC | Total acquisition spend ÷ number of new customers | Customer acquisition | Growth planning, payback analysis, and assessing whether scaling is sustainable | Does not account for customer quality, retention, or lifetime value |
The key takeaway is that these metrics are not direct substitutes. ROAS supports tactical decisions, MER gives a business-level view, and CAC helps determine whether customer growth is economically sustainable.
The Three Core eCommerce Marketing Metrics
Each metric reveals a different layer of performance, from individual campaigns to the overall cost of growth.
ROAS: A Campaign-Level Performance Metric
Formula: Attributed Revenue ÷ Ad Spend
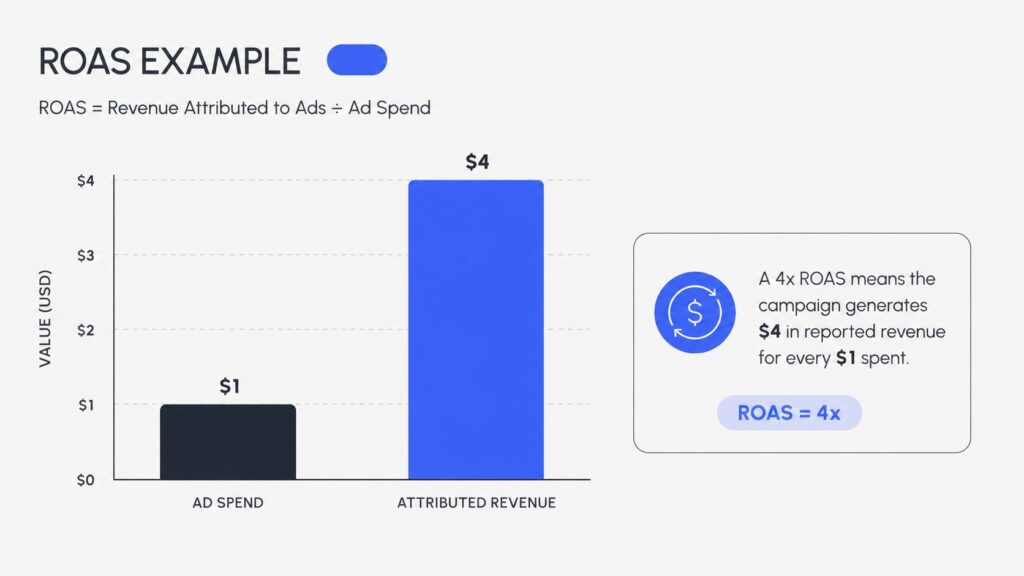
ROAS shows how efficiently a particular campaign or advertising channel converts spend into attributed revenue. If a campaign has a 4x ROAS, it generates $4 in reported revenue for every $1 spent.
Best for: Evaluating creatives, audiences, campaigns, and channels. It helps marketers identify what is working inside an ad platform and make short-term budget adjustments.
What it misses: ROAS does not reflect the full cost of growth. It leaves out expenses such as content production, agency fees, discounts, and other marketing costs. It also relies on platform attribution, which may overstate the role of a specific channel.
For that reason, ROAS is most valuable as an optimization signal not as proof that the business is profitable.
MER: A Business-Level View of Marketing Efficiency
Formula: Total Revenue ÷ Total Marketing Spend
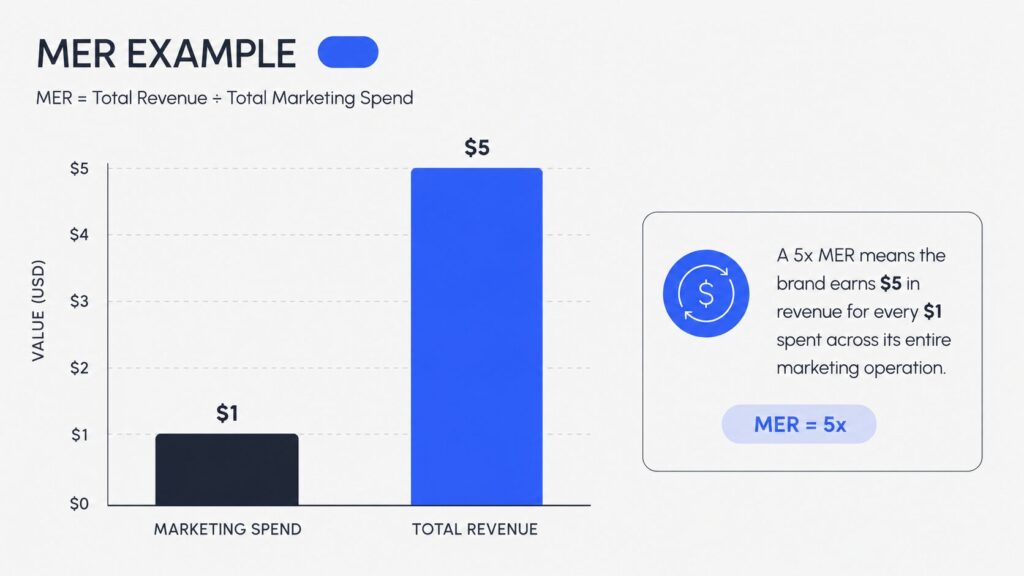
MER, or Marketing Efficiency Ratio, shows how much total revenue the business generates for every dollar invested in marketing. A 5x MER means the brand earns $5 in revenue for every $1 spent across its entire marketing operation.
Best for: Reviewing overall marketing efficiency, setting budgets, monitoring performance over time, and evaluating whether higher spending is producing sustainable growth.
What it misses: MER provides a broad view but does not explain which campaigns or channels are driving the result. It can also be influenced by repeat purchases and organic revenue, making it harder to isolate new customer acquisition performance.
MER is most useful for understanding the health of the marketing operation as a whole, while channel-level metrics help explain what is happening underneath.
CAC: The Cost of Acquiring a Customer
Formula: Total Acquisition Spend ÷ Number of New Customers Acquired
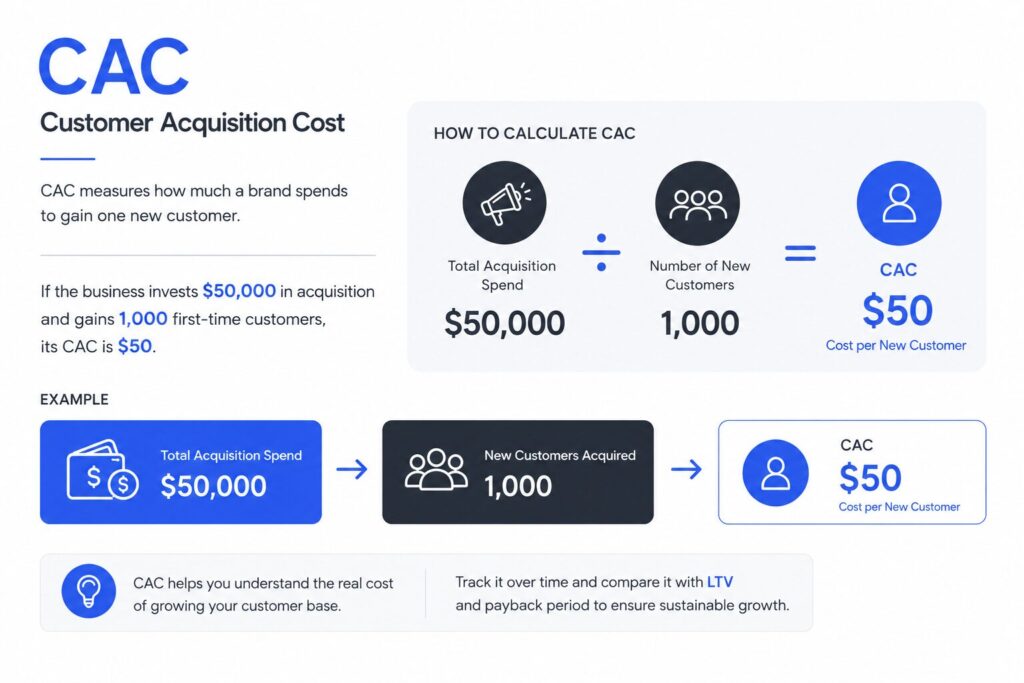
CAC, or Customer Acquisition Cost, measures how much a brand spends to gain one new customer. If the business invests $50,000 in acquisition and gains 1,000 first-time customers, its CAC is $50.
Best for: Growth planning, forecasting, evaluating scalability, and comparing acquisition costs with customer lifetime value and payback period.
What it misses: CAC does not reveal the quality of the customers acquired. Two channels may generate customers at the same cost, but those customers can differ significantly in order value, retention, and long-term profitability.
CAC becomes more meaningful when viewed alongside LTV, repeat purchase rate, gross margin, and the time required to recover the acquisition cost.
How to Calculate Each Metric in Practice
The formulas are simple. Sourcing clean, comparable data is the harder part.
- ROAS. Attributed revenue comes from the ad platform itself (Meta, Google, TikTok), using that platform’s attribution window, usually 7 day click / 1 day view. Spend comes from the same platform.
Pitfall: platforms use different attribution models, so a 4x ROAS on Meta and a 4x ROAS on Google aren’t measuring the same thing. Normalize the window across platforms, or pull revenue from one shared source like GA4. - MER. Total revenue comes from your store platform or analytics tool, the full unified figure, not a sum of platform-reported numbers. Total spend must include every media dollar: paid social, search, affiliate, influencer, agency fees.
Pitfall: leaving out smaller channels or agency retainers inflates the ratio and hides real cost. - CAC. Spend is the same total used for MER. The denominator, new customers, should come from your store or CRM, filtered to first-time purchasers in the same period as the spend.
Pitfall: platforms often flag “new” based on email or account creation, which miscounts repeat buyers using a different email or guest checkout. Define “first-time customer” once and apply it consistently.
Whatever rules you choose for the attribution window, revenue source, and customer definition, keep them fixed over time. Changing a definition mid-quarter makes a measurement shift look like a performance shift.
When Metrics Disagree
Individually, each metric can look fine. The real signal is in how they move relative to each other.
| Symptom | Likely Cause | What to Check |
| ROAS rising, MER falling | A channel is claiming credit for sales that would have happened anyway (retargeting, branded search) | Attribution window overlap with organic and email revenue |
| CAC flat, MER falling | Spend mix has shifted toward retention or discounting rather than new customers | Share of budget by funnel stage, discount depth |
| MER rising, CAC rising | Growth is coming from organic demand or repeat customers, not paid acquisition | New vs. returning customer revenue split |
| ROAS similar across channels, CAC very different | Channels are producing different customer quality at similar reported efficiency | LTV and repeat rate by channel, not just first order |
| All three improving together | Paid media is driving real, incremental, profitable growth | Confirm with a holdout or incrementality test if scaling further |
The direction of the gap between any two metrics is usually the earliest warning that a dashboard number is about to stop reflecting reality. A single metric moving in isolation rarely tells you why. The relationship between two does.
Which Metric Should Your eCommerce Brand Use?
There is no single metric that works for every decision. Choose the metric based on the question you need to answer:
- Use ROAS to compare campaigns, creatives, audiences, or channels and make tactical advertising decisions.
- Use MER to evaluate the efficiency of your total marketing budget and understand whether increased spend is driving overall revenue growth.
- Use CAC to measure the cost of acquiring new customers and determine whether your acquisition strategy is financially sustainable.
- Use all three together to connect campaign performance with overall marketing efficiency and the economics of customer growth.
How to Set Break-Even Targets for ROAS, MER, and CAC
Generic benchmarks can be useful for context, but they should not determine how much your brand can afford to spend. Your actual targets need to reflect gross margin, fulfillment costs, payment fees, discounts, returns, and the amount of profit you want to keep after marketing.
Start by calculating how much contribution margin remains before marketing. That figure shows the maximum share of revenue available for acquisition without pushing the business below its profitability target.
From there, define:
- Break-even ROAS: The minimum return required for ad spend to cover the costs included in your model.
- Target MER: The level of total marketing efficiency that keeps spending within an acceptable percentage of revenue.
- Maximum CAC: The highest amount the brand can spend to acquire a customer while maintaining the desired payback period and contribution margin.
For example, if a brand can allocate 20% of revenue to marketing, its corresponding efficiency target is 5x. But that target may need to be higher for a low-margin business or lower for a brand with strong retention and repeat purchases.
The important point is that ROAS, MER, and CAC targets should come from your unit economics, not from a competitor’s dashboard or an industry average.
Common Mistakes When Tracking ROAS, MER, and CAC
Even accurate calculations can lead to poor decisions when metrics are interpreted without context.
Treating ROAS as Profit
ROAS measures attributed revenue but ignores margins, fulfillment, fees, agency costs, and other expenses.
Solution: Compare ROAS with your break-even target and contribution margin before deciding whether a campaign is profitable.
Comparing Data from Different Platforms
Meta, Google, and analytics tools use different attribution models and may claim credit for the same purchase.
Solution: Choose one primary reporting source and use the same attribution window when comparing performance over time.
Including Existing Customers in CAC
Using total customers or orders makes acquisition costs look lower than they actually are.
Solution: Calculate CAC using only first-time customers acquired during the same period as the marketing spend.
Ignoring Customer Quality
A stable CAC can hide lower order values, weak retention, or longer payback periods.
Solution: Review CAC alongside LTV, repeat purchase rate, contribution margin, and payback period.
Reacting to Short-Term Changes
Daily results can be distorted by reporting delays, promotions, seasonality, and normal fluctuations in demand.
Solution: Evaluate trends over consistent weekly or monthly periods before making major budget changes.
Keeping the Same Targets as Costs Change
Old benchmarks become unreliable when prices, margins, discounts, shipping costs, or fees change.
Solution: Recalculate break-even ROAS, target MER, and maximum CAC whenever the economics of the business change.
How Often Should You Review Each Metric?
Not every metric should be checked on the same schedule. Reviewing them too often can create noise, while reviewing them too rarely can delay important decisions.
Review ROAS Weekly
ROAS is most useful for short-term campaign optimization. Check it weekly to compare creatives, audiences, and channels, but avoid making major decisions based on one or two days of data.
Review MER Monthly
MER is better suited to monthly and quarterly reporting because it reflects total marketing spend and total revenue. This timeframe makes it easier to identify whether efficiency is improving or declining at the business level.
Review CAC Monthly or by Cohort
CAC should be tracked monthly and by customer cohort whenever possible. This helps connect acquisition cost with retention, repeat purchases, and payback period over time.
Turn Marketing Metrics Into Better Growth Decisions
MER, ROAS, and CAC work best together. Combined, they connect campaign performance with marketing efficiency, acquisition costs, and profitable growth.
Ready to turn scattered metrics into a clear growth strategy? VIDEN Growth helps eCommerce brands uncover what is actually driving revenue, set the right performance targets, and allocate budget with greater confidence. Partner with our team to build a measurement framework that supports smarter scaling and stronger profitability.
FAQ
ROAS measures revenue attributed to advertising, MER compares total revenue with total marketing spend, and CAC shows how much it costs to acquire a new customer.
MER is better for evaluating overall marketing efficiency, while ROAS is more useful for campaign-level optimization. Most eCommerce brands should track both.
There is no universal benchmark. A sustainable MER depends on gross margin, operating costs, retention, and profitability targets.
Use ROAS to optimize advertising performance and CAC to understand whether customer acquisition is financially sustainable. The strongest decisions come from reviewing both alongside MER.